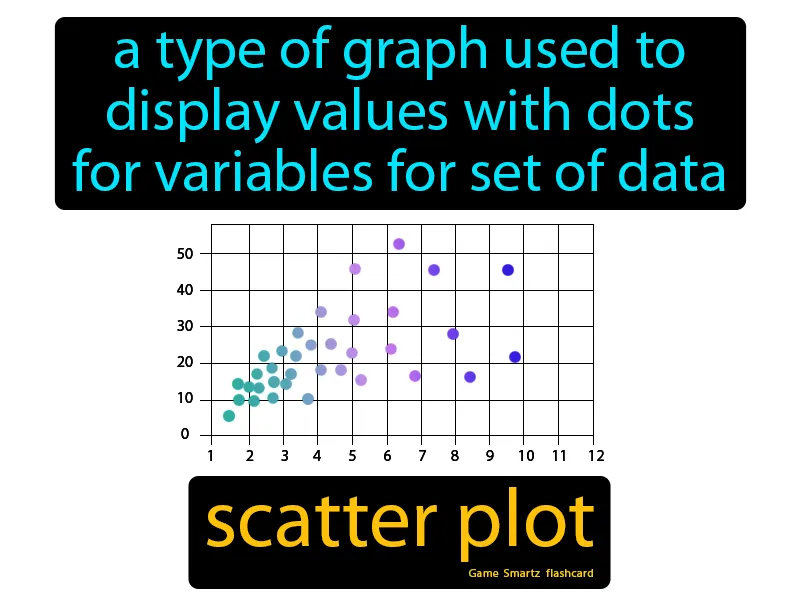
Scatter Plot
Scatter Plot: Easy to understand
Imagine trying to find the best spot to park your car in a crowded lot where some spaces are closer to the entrance, and others are more shaded. Just like you assess each parking spot based on different factors like distance and shade, a scatter plot helps you evaluate data points based on multiple variables. In this analogy, each parking spot is like a dot on the scatter plot, where the distance to the entrance and amount of shade represent the different variables plotted on the x and y axes, helping you visualize and decide the best options at a glance.

Practice Version

Scatter Plot: A type of graph used to display values with dots for variables for a set of data. Scatter plot. In science, a scatter plot is a graph that shows the relationship between two variables by displaying data points on a grid.