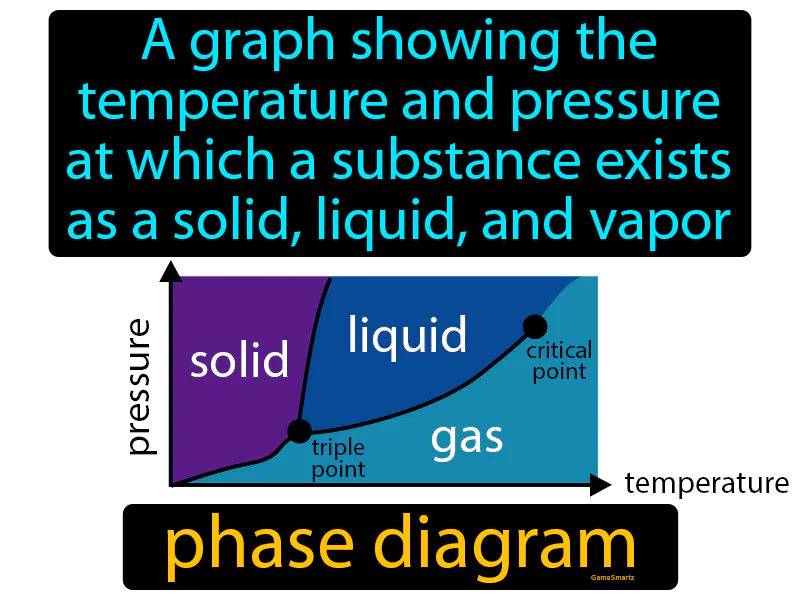
Phase Diagram
Phase Diagram:
Imagine you're trying to decide what to wear based on the weather forecast, which predicts varying temperatures and amounts of rain throughout the day. Just as you need to choose an outfit that suits the specific combination of temperature and rain, a phase diagram helps determine the state of a substance (solid, liquid, or vapor) based on temperature and pressure. In this analogy, your clothing choices are like the phases of the substance, the temperature is akin to the ambient temperature in the weather forecast, and the pressure is comparable to the amount of rain, both of which dictate the most appropriate "state" for you or the substance.

Practice Version

Phase Diagram: A graph showing the temperature and pressure at which a substance exists as a solid, liquid, and vapor. Phase diagram. A phase diagram shows the conditions under which a substance changes states, like solid, liquid, or gas.